
In the final part of a look into the Am Law 200 rankings, we take a look at how top law firms converted lawyers into revenue and then revenue into profits
This 3-part series was written by Bruce MacEwen and Janet Stanton of Adam Smith, Esq.
In the previous installment of this three-part series analyzing the recently released Am Law 200, we asked if the Am Law 200 is even a useful way to categorize law firms for purposes of strategy or even simple benchmarking. Spoiler alert: We concluded it was not.
The key empirical pillar upon which we rested that conclusion was the dramatic dispersion within the five quintiles of law firms in the Am Law First 100 among the ratios of their i) gross revenue to ii) lawyer headcount to iii) net operating income.
In a nutshell, the data showed that the top 20 law firms — the first quintile — were in the enviable position of achieving a greater share of net operating income than they had in revenue, and a greater share of revenue than that of lawyers. In other words, firms in this fortunate cohort (on average) were remarkably effective — more so by far than the other 80 firms — at converting lawyers into revenue and then revenue into profits. With apologies to the Gershwins, it’s nice work if you can get it.
At the end our last installment we promised to take a 10-year look back at the Am Law 100 and see if that pattern held. Well, we have done that analysis, and the answer is not exactly.
To be specific, the positions of the five quintiles in terms of their relative shares of the above-mentioned three key data series has migrated noticeably over the past decade. The 2020 pattern may be the logical evolution of what has gone before (and we believe it is), but it has indisputably been an evolution and not a steady state of affairs.
First, the numerical and graphical views into the numbers, and then, our thoughts on what might be going on underneath the covers.
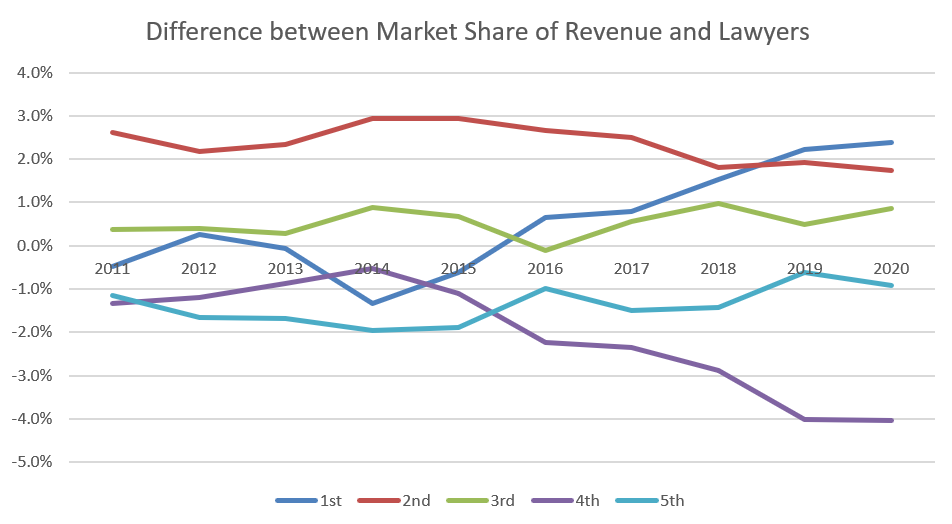
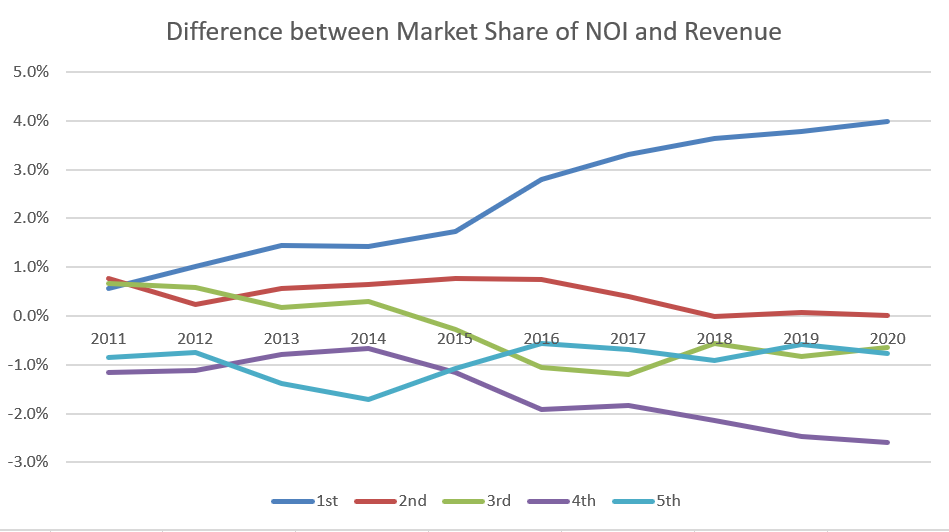
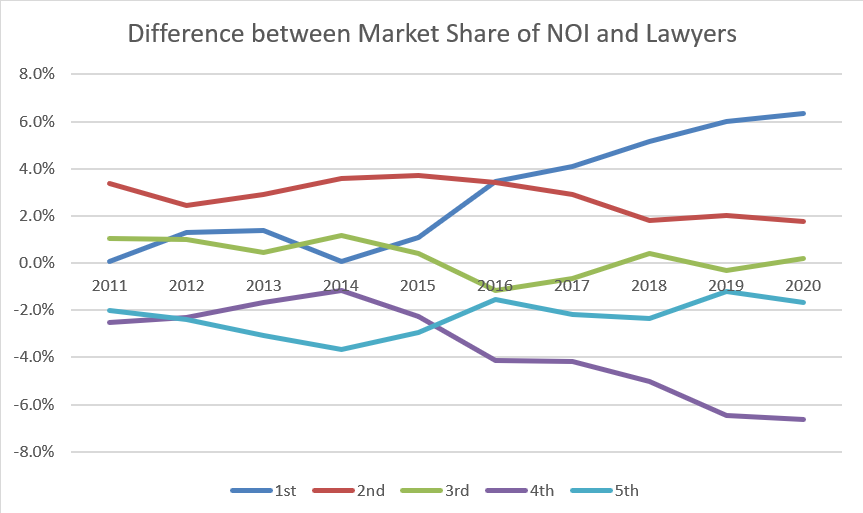
Numerically[*] the big news on all three bakeoffs — revenue vs. number of lawyers, net operating income (NOI) vs. revenue, and NOI vs. number of lawyers — is the surprising consistency across the five quintiles. Generalizing across the decade:
-
-
- The 1st quintile performs the best by far, rising consistently on all measures;
- The 2nd quintile started strong but deteriorated steadily from there;
- The 3rd and the 5th quintiles are very stable, and both show no real deviation from the 100-firm average; and
- And the 4th quintile convincingly finishes at the rear of the pack, showing the worst performance of all — starting in last place among the five quintiles and losing even more ground from there.
-
If you have digested that brief exercise in narrative numeracy, let’s now look at some pictures:
Now that we can visualize the big picture, here’s what we see happening at the macro level:
-
-
- The 1st and 2nd quintiles have traded places: At the beginning, the 2nd strongly outperformed the 1st on two of the three metrics and matched it on the third. Today, the 1st appears almost insurmountably in the lead, especially on the two more purely financial series pairings — generating more NOI from revenue, and more NOI per lawyer.
- The 3rd and 5th quintiles are living steady, relatively unexciting lives. They’re not taking gold or silver, but they’re very rarely at risk of bringing up the rear.
- The Sad Cousin award then goes to the 4th quintile, hands-down.
-
So, what do we make of all this?
First and foremost, no one among the 4th quintile firms is suffering in the least. (Indeed, their relative position may be what whomever coined the term First World problem had in mind.) That one quintile or another would bring up the rear was effectively built into the techniques we used to analyze the data. They were designed to force-rank winners and losers.
Reflect for only a moment
For each of the 10 years in our sample, the Am Law 100 firms together generated a finite and defined amount of revenue and NOI using a finite and defined number of lawyers. If one cohort is up, another has to be down. This is truly a zero-sum analysis.
And if no one firm in the 4th quintile is suffering — a self-evident truism if ever there were one since most Americans would trade their current station for a position in any of the 4th quintile firms in a heartbeat — then, a fortiori, life in the 3rd and 5th quintiles is also splendid.
To us, the fascinating pattern we discovered when we turned over this rock was the 1st and the 2nd swapping places. To generate a hypothesis that might explain that, we took a detailed look at exactly which firms were in those two quintiles (yes, by name) over the years in question. Wisely or rashly, here’s what we think may have been happening.
What if the caliber of lawyers and of firms that make up the 1st and 2nd quintiles has slowly been preferentially migrating, in quality, elite reputation, and prestige, to the 1st quintile? In other words, our impressionistic view is that there were some extraordinarily high-caliber firms in both quintiles 10 years ago, but now the 1st quintile is almost embarrassingly top-heavy on high-prestige firms and the 2nd has lost several through up-market (into the 1st) and down-market (out of the 2nd) moves.
Definitively proving or disproving that would require a minute analysis of all of (or a very large sample of) lateral partner moves, client defections and acquisitions, positive or negative media mentions, and perhaps more, across all those law firms for the past decade. If some intrepid forensic data analyst out there was casting about for their next project, be our guest.
In the meantime, consider this possible theoretical explanation: If labor markets are efficient — and there’s no reason to think the market for talented lawyers suffers systemic informational asymmetries or other modalities of market failure — then the past decade has seen the rational and efficient sorting of Big Law Firm partner talent from platforms that may be suboptimal towards platforms that are a better fit.
Understand that this should — and if our theory has legs, surely has — worked both ways. A Big Law partner can find themselves at the wrong firm because their skillsets and ambitions cannot find adequate expression and running room where they are or because they’re in highly rarefied air — too rarefied for their comfort.
Those who read us frequently know that the ever-upward spiral of lateral partner moves in the legal industry has left us a bit unconvinced, but what we may be seeing here in the swap between 1st and 2nd quintiles since 2011 implies it’s not all churn. There might be an efficient labor market out there after all.
Final thoughts
We cannot resist offering a thought in closing by way of, “What on earth do you think I should actually do with this?”
The literature on leadership speaks with one voice on little; however, there is near-universal agreement that one prerequisite for strong leadership is knowing yourself. So, know your firm. The vast majority of readers will not be in the 4th or the 1st quintiles. But it doesn’t really matter where your firm is: Remember, even the 1st and 4th quintile patterns we’ve been discussing are the averages for those quintiles. Individual firms differ.
So, forget where you are, and calculate how your own firm’s gross revenue, NOI, and lawyer headcount stack up against some plausible, publicly available benchmark data.
If you discover your firm looks like a 1st or like a 4th quintile firm, you have learned quite a bit already. Think of these patterns as packed full of information.
Which pattern your firm more closely lines up with will help determine, among other things, what talent you can recruit, and what degree of difficulty, in terms of client matters, for which your firm can compete. If you like where you are, reinforce the strategic, cultural, and economic conditions and aspirations that got you there — that’s easy (as if anything in leading a law firm were easy).
If you don’t like the pattern your performance resembles, you have one simple and one complex task ahead of you. The simple one: Figure out what strategic and tactical adjustments would help your firm pass advance to the level you envision; and the complex one: Persuade your partners to undertake these adjustments, and engineer the cultural shifts that would be required to make it stick.
Now, aren’t you glad you asked what to do with this?